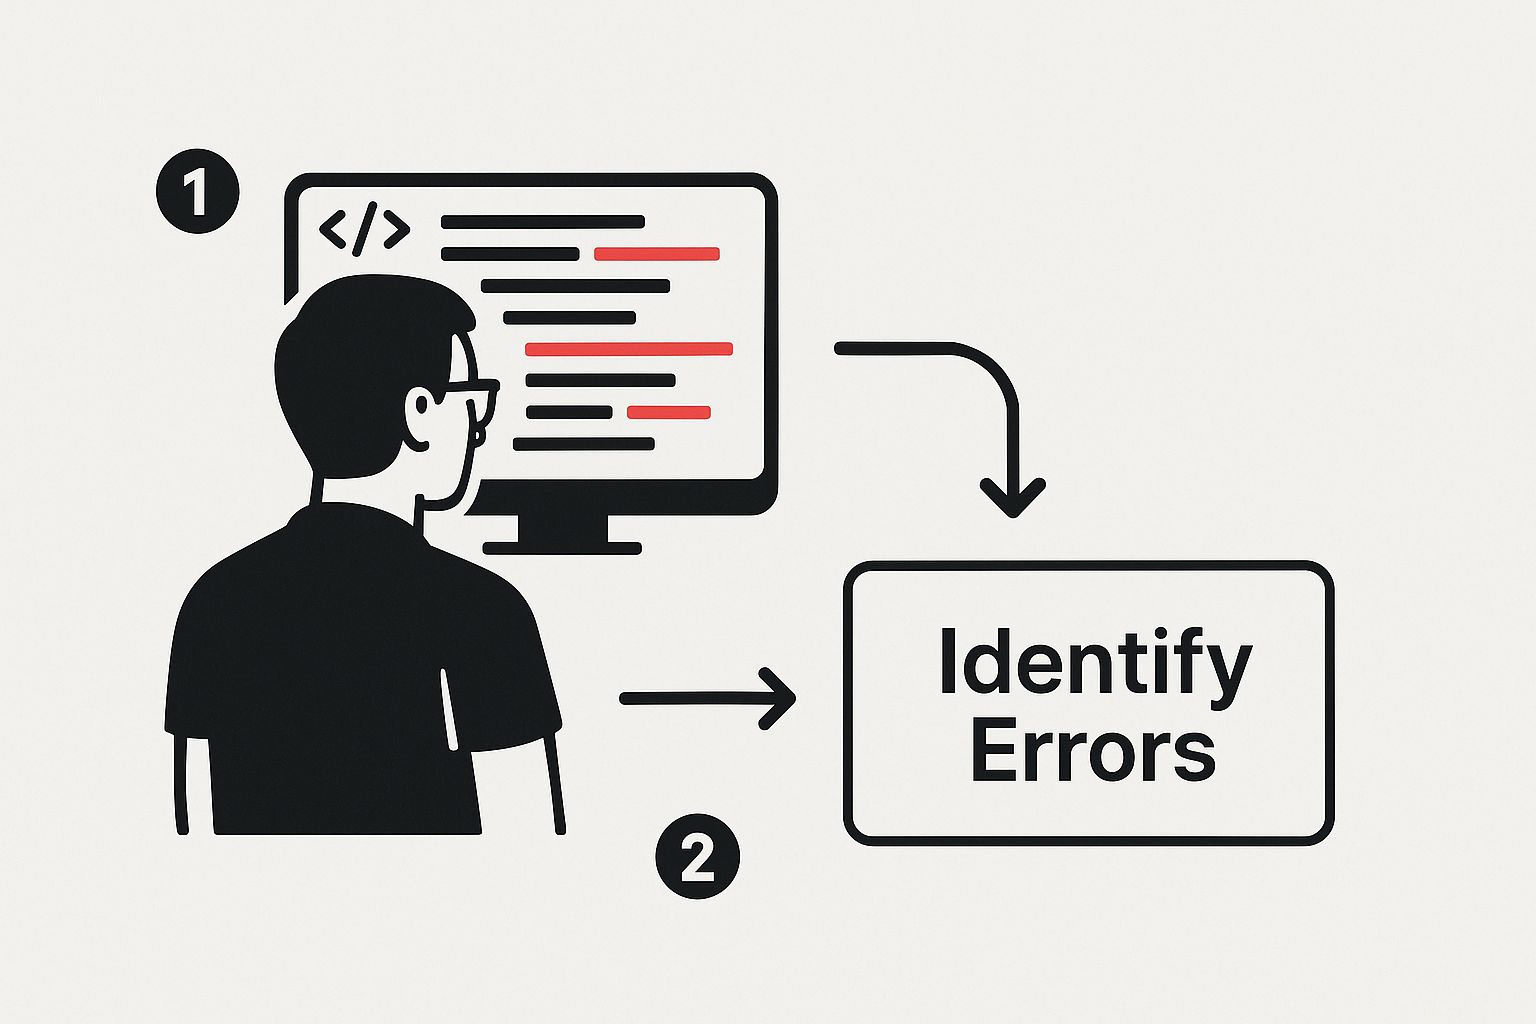
We’ve all been there. You push a new feature, hit refresh with anticipation, and… nothing. A quick look at the developer console reveals a stark, red message: 'Uncaught TypeError'. That sinking feeling is familiar to every developer, but learning how to fix JavaScript errors effectively starts with changing how you see them.
This guide is designed to get you from feeling stuck to feeling confident, giving you a clear, practical roadmap for debugging your site, whether it's on WordPress, WooCommerce, or a totally custom build.
Why JavaScript Errors Happen and How to Approach Them
First things first: running into a JavaScript error doesn’t mean you’ve failed. It's a completely normal part of building things for the web. Think of it less as a roadblock and more as a puzzle. Every error message is a breadcrumb trail leading you straight to the source of the issue. The real trick is to stop seeing them as frustrating dead ends and start treating them as helpful signposts on the path to a solution.
Getting to the Root of the Problem
When you boil it down, most JavaScript errors stem from just a handful of common culprits. Once you learn to recognise the patterns, you’ll find that the same kinds of issues pop up again and again, making them much faster to diagnose and resolve.
Here are the usual suspects:
- Simple Syntax Mistakes: A forgotten comma, a mismatched bracket, or just a plain old typo. These are often the easiest fixes, but they can be maddeningly difficult to spot after you’ve been staring at the same block of code for hours.
- Flaws in Logic: Your code runs without throwing an outright error, but it just doesn't do what you want it to. A classic example is a variable not holding the value you expected it to at a crucial point in the script's execution.
- Script Conflicts: This is a big one, especially in the WordPress ecosystem. You might have multiple plugins and a theme all trying to load their own JavaScript files. Sometimes they don't play nicely together, causing one script to break another. For a much deeper look into this specific problem, our guide on resolving plugin and theme errors is a great resource.
Honestly, the best debugging tool you have is your own perspective. If you can approach an error with genuine curiosity instead of frustration, you turn a tedious task into a chance to learn something new.
At the end of the day, every developer—from the newest junior to the most seasoned senior—spends a good chunk of their time hunting down bugs. The goal isn’t to write perfect, bug-free code from the start. It’s to get incredibly efficient at finding the problems and fixing them.
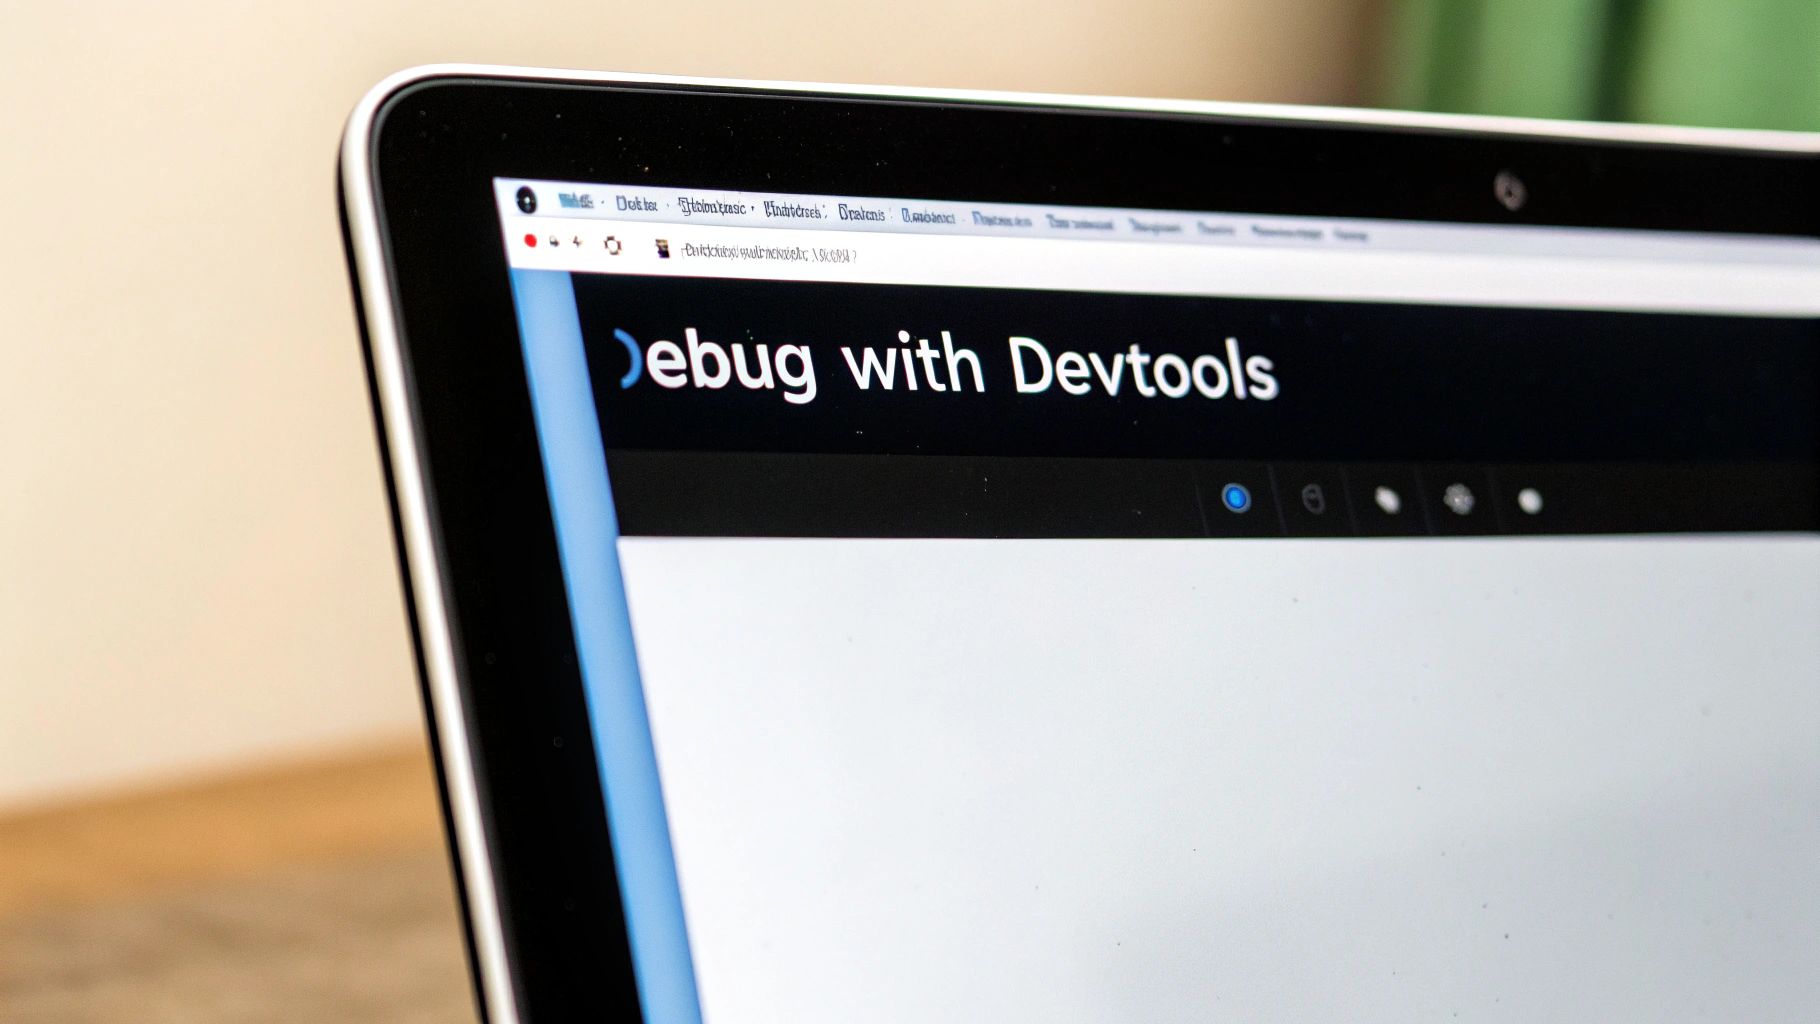
Mastering the Browser Developer Console for Debugging
When JavaScript starts acting up on your site, your best friend is already waiting for you, built right into your web browser. I’m talking about the developer console. It might look intimidating at first, but it's a diagnostic powerhouse that tells you exactly what’s broken and, crucially, where to find it.
To get started, just right-click anywhere on your webpage, select "Inspect," and then click the "Console" tab. This is your command centre for hunting down bugs. The real skill is learning to read what it's telling you. Those messages, which can seem a bit cryptic, are actually your biggest clues.
Decoding Common Error Messages
Let's break down some of the usual suspects you'll see in the console and what they actually mean in practice. I've seen these countless times.
- ReferenceError:
xis not defined: This is probably the most common one. It just means you’ve tried to use a variable or a function before it was created, or you've simply made a typo in the name. Think of it like calling a friend by the wrong name – they won't respond because they don't realise you're talking to them. - TypeError: Cannot read properties of null (reading 'style'): A
TypeErrorpops up when you try to perform an action on the wrong type of data. In this specific example, the script tried to change thestyleof an HTML element, but it couldn't find that element on the page. It got backnullinstead of an object, and you can't read properties of 'nothing'. - SyntaxError: Unexpected token '{': This one is a showstopper. It means the browser's JavaScript engine couldn't even understand your code because of a structural mistake. It could be a missing bracket, an extra comma, or a forgotten quote mark. It's a fundamental grammar error that prevents the script from running at all.
As you can see, the first step is always to pinpoint the exact error message. That message is your starting point for the entire debugging process.
Going Beyond Simple Error Messages
The console is so much more than just a list of red error messages. You can use it interactively to follow your code as it runs. By dropping console.log() statements into your script at key points, you can print out the values of variables and see precisely where things start to go wrong.
If a calculation is producing the wrong result, for instance, you could log the inputs right before the calculation to check if they're what you expect.
My Pro Tip: Don't just stick with
console.log(). Useconsole.warn()for important messages you don't want to miss. They show up in yellow and are much easier to spot in a sea of other logs. For critical issues,console.error()is styled in red, making it impossible to ignore.
For some next-level debugging, hop over from the "Console" to the "Sources" tab. This is where you can find your actual JavaScript file and set breakpoints. A breakpoint is literally a pause button for your code. When the browser hits that line, it freezes the script's execution. This allows you to meticulously inspect the state of every variable at that exact moment and then step through your code one line at a time. It’s like having a slow-motion replay for your script.
Adopting a Proactive Error Monitoring Strategy
Relying on vague bug reports from your users is one of the most inefficient ways to tackle issues. A message saying "the button doesn't work" gives you almost nothing to go on. Was it a specific browser? A certain device? What did they do right before it broke? This reactive cycle is frustrating and slow, but there's a much better way to handle things.
Instead of waiting for problems to be reported, you can get ahead of the curve. This involves using modern error monitoring platforms that go far beyond what your local browser console can ever show you.
Think of these services as a black box recorder for your website. They capture every single JavaScript error that your real users encounter in the wild, no matter what device or browser they're using.
The Power of Telemetry Data
The real game-changer with these tools is the rich telemetry data they provide. This isn't just an error message; it's the full story of what happened before the bug occurred.
Imagine getting a report that includes:
- The exact sequence of user clicks and actions leading up to the error.
- A log of all network requests made by the browser.
- The state of the application and key variables at the moment of failure.
- Detailed browser and device information (e.g., Chrome 125 on Android 14).
This context is the missing piece of the puzzle. It allows you to reliably reproduce the bug in your own development environment, which is often the hardest part of fixing it. When you can see the error happen for yourself, finding the solution becomes much, much easier.
This shift from reactive to proactive monitoring is profound. It turns debugging from guesswork into a data-driven process, allowing you to fix JavaScript errors before the majority of your users even notice a problem exists.
The impact here is significant. Modern error monitoring tools like TrackJS.com have genuinely changed how developers work, enabling them to resolve issues before they escalate. Many organisations report seeing up to a 40-60% faster bug fix cycle when using these telemetry-based solutions.
Choosing the Right Monitoring Tools
Moving to a proactive model means selecting the right tools for the job. While there are many options out there, they all share a common goal: to give you complete visibility into your application's health. Integrating one of these platforms is often as simple as adding a small snippet of JavaScript to your site.
These platforms are a core component of a broader strategy. To get the most out of them, it helps to understand the wider world of website performance monitoring. If you're keen to explore this further, you might be interested in our guide on website performance monitoring tools.
Fixing Bugs That Harm Accessibility and User Experience
Not every JavaScript bug shouts its presence with a big, red error message in the console. In my experience, some of the most damaging issues are completely silent. They don't crash your site; they just quietly chip away at your user experience, creating frustration and, in some cases, making your site completely unusable for people with disabilities. This is where knowing how to fix JavaScript errors goes beyond just code—it’s about people.
Poorly written JavaScript is a common culprit behind major accessibility roadblocks. Imagine a checkout form where the "Pay Now" button simply doesn't respond when someone tries to use their keyboard instead of a mouse. Or what about a "Product added to cart!" pop-up that appears visually but is never announced to a shopper using a screen reader? These aren't just minor annoyances; they are genuine barriers that can exclude customers.
Uncovering the Silent Problems
You might be surprised at how widespread this issue is. An astonishing number of websites have detectable accessibility failures. According to the most recent WebAIM Million report, a huge chunk of common accessibility problems come from JavaScript behaving badly.
These bugs often hide in plain sight because they don’t affect every single visitor. A developer might click through a new feature with a mouse, see it works perfectly, and sign off on it, completely oblivious that the same element is totally broken for keyboard navigation. This is exactly why a broader, more empathetic approach to testing is so crucial.
A More Inclusive Debugging Workflow
To catch these subtle yet destructive bugs, you need to look beyond the standard developer console. The best way to build more robust and inclusive sites is to weave accessibility checks right into your everyday debugging process.
Here are a few habits I’ve found invaluable:
- Automated Accessibility Checkers: Browser extensions like WAVE or axe DevTools are fantastic. They scan your page and immediately flag common accessibility violations, like missing ARIA attributes on dynamic widgets or colour contrast issues created by your scripts.
- Manual Keyboard Testing: This is one of the simplest and most powerful tests you can do. Put your mouse aside and try to navigate your entire site—menus, forms, pop-ups, everything—using only the Tab key. If you get stuck anywhere, that’s a dead giveaway your JavaScript is hijacking the browser's natural focus order.
- Screen Reader Emulation: Try to experience your site the way a visually impaired user would. Your operating system has a screen reader built-in (VoiceOver on macOS, Narrator on Windows). Firing it up and listening to how your site is announced can be a humbling experience.
Think of these checks not as an extra chore, but as a fundamental part of quality control. An inaccessible feature is a broken feature, period. It’s just as broken as one that throws a console error.
Ultimately, these usability bugs can be just as harmful to your site's success as a catastrophic failure like the dreaded white screen in WordPress. By combining your traditional debugging skills with a focus on accessibility, you build a site that truly works for everyone.
When to Bring in Specialised JavaScript Expertise
Let's be honest, there's a certain satisfaction that comes from tracking down and squashing a tricky bug yourself. But sometimes, you hit a wall. A JavaScript error might be buried so deep in a complex application or so tangled up in a legacy codebase that your time spent fixing it starts to cost more than bringing in a specialist would.
Knowing when to call for backup is a skill in itself. It's not about admitting defeat; it’s a smart, strategic move. The main goal, after all, is to get your website back up and running smoothly, as quickly and efficiently as possible. Stubborn, persistent errors can halt progress on new features, tarnish your brand's reputation, and hit your revenue directly.
When Is It Time to Call an Expert?
If you find your team going around in circles on the same issue without getting any closer to a solution, that's a pretty clear sign. This is especially true for those maddeningly intermittent problems that you can't seem to reproduce on demand—those often need a seasoned expert with deep diagnostic experience.
For many businesses, the quickest route to resolving complex JavaScript errors is to hire a skilled contractor. As noted in these UK market insights for JavaScript developers on gravitasgroup.co.uk, there's a huge demand for developers who can parachute in, debug complex code, and get things sorted.
What Specialised Skills Should You Look For?
When you decide to hire externally, you're not just looking for a generalist coder. You need an expert whose experience lines up with your specific challenges.
Here are a few key skills to look for:
- Modern Framework Proficiency: If your application is built on React, Vue, or Node.js, you need someone who knows these frameworks inside and out.
- Legacy Code Modernisation: The ability to carefully untangle and refactor old, messy code without breaking the entire system is a rare and incredibly valuable skill.
- Performance Optimisation: A true expert can pinpoint the exact JavaScript that's slowing your site down, which is a huge win for both user experience and SEO.
- CI/CD Pipeline Implementation: Look for experience with Continuous Integration and Continuous Deployment (CI/CD). This helps build automated processes that catch errors long before they ever make it to your live site.
Investing in the right expertise—whether that means upskilling your current team or bringing in a specialist—is a fundamental part of any solid error-resolution plan.
Writing Error-Resistant JavaScript from the Start

While getting good at debugging is essential, the real pro move is writing code that avoids bugs in the first place. You can save yourself a world of pain by building a few solid habits right from the start. It’s about shifting from a reactive "fire-fighting" mode to proactively building more resilient, stable websites.
Think of it as preventative maintenance for your code. You service your car to stop it from breaking down, and the same logic applies here. Writing clean, defensive code shuts the door on common errors before they ever get a chance to cause trouble.
Enforce Stricter Rules with 'use strict'
This is one of the simplest and most effective habits to get into. Just start every one of your JavaScript files with the line 'use strict';. That one little string flips a switch in the JavaScript engine, putting it into a more restrictive mode.
Suddenly, a bunch of common, silent mistakes will start throwing actual errors you can see. For example, strict mode will flag you if you accidentally try to use a variable you haven't declared yet. This alone can save you from a mountain of ReferenceError headaches caused by simple typos. It's an easy win that instantly tightens up your code.
Adopting
'use strict';is like having a free proofreader looking over your shoulder. It catches the silly mistakes that lead to hours of frustrating debugging, helping you learn how to fix JavaScript errors by preventing them.
Use Linters to Catch Issues Early
Another absolute game-changer is using a linter like ESLint. Think of a linter as an automated tool that scans your code as you type, flagging everything from syntax mistakes to code that just doesn't follow best practices.
You can configure ESLint with a specific set of rules. For instance, you can tell it to flag any unused variables or enforce consistent use of single vs. double quotes across the project. It hooks right into your code editor, highlighting problems in real-time. This not only helps you fix issues on the spot but also naturally builds better coding habits, keeping your codebase clean and predictable.
Conclusion
Tackling JavaScript errors can feel daunting, but it's a skill that grows with every bug you squash. By understanding the common culprits, mastering your browser's developer tools, and adopting a proactive mindset, you transform errors from frustrating stops into learning opportunities. Remember to also consider the silent accessibility issues that can be just as damaging.
By writing cleaner code from the start and knowing when to call in an expert for those truly stubborn problems, you can build more robust, reliable, and user-friendly websites.
If you’re ready to take the next step in managing your WordPress or WooCommerce site and need expert support, our team is here to help. Contact us to learn more about our website repair and maintenance services.
Article created using Outrank